The Cost of Downtime in 2026: What the Data Says
The $5,600-per-minute figure is a dead 2014 stat. Here are the current, sourced downtime-cost numbers from 2026 research, and how to reason about your own.

Key Takeaways
- The downtime-cost numbers everyone quotes are stale, and two of the most-cited are unusable. Gartner's $5,600 per minute dates to 2014 and its source page is dead; a widely shared $793,957 figure has no method attached and its arithmetic does not reconcile. Use current research instead.
- The largest 2026 study puts the aggregate cost of downtime at $600 billion a year for the Global 2000. Splunk's report with Oxford Economics, a "survey of 2,000 executives across the Global 2000," found unplanned outages cost an average of $300 million per company per year.
- Downtime cost is rising fast. The same Splunk research reports downtime costs "surging 50% in just two years," and an average "3.4%" stock-price drop following a single incident.
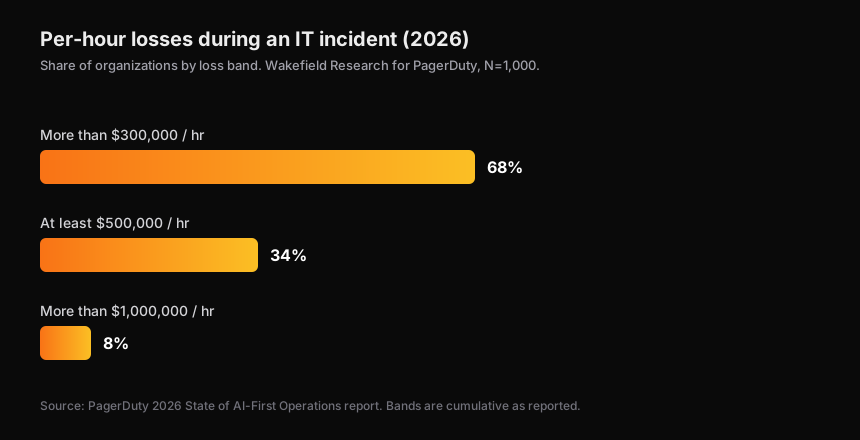
- Per-hour losses are concentrated at the high end. PagerDuty's 2026 State of AI-First Operations report (Wakefield Research, 1,000 respondents) found 8% of organizations lose more than $1 million per hour, 34% lose at least $500,000 per hour, and 68% lose more than $300,000 per hour during incidents.
- The cost is not only revenue. The same PagerDuty research lists incident impacts including "damaging brand reputation (52%)," "recovery costs (50%)," and "developer burnout (42%)."
- A single blended dollar-per-minute number will mislead you. Cost is dominated by which service is down, for whom, and when. Treat the industry figures as an order of magnitude and compute your own.
- The lever these numbers point to is containment and faster diagnosis, not a bigger headline. How to reason about your own exposure, and what actually moves it, below.
The cost of downtime is the total business loss from an unplanned outage, and the most defensible 2026 research puts it at an average of $300 million per year for a Global 2000 company, or an aggregate of $600 billion across those firms. The per-minute and per-hour figures that circulate in vendor decks are mostly a decade old, and two of the most repeated ones cannot be sourced at all. This post replaces them with current, cited numbers and shows how to reason about your own exposure without inventing a figure.
What does downtime actually cost in 2026?
The single best-sourced answer comes from Splunk's downtime report with Oxford Economics, based on "a survey of 2,000 executives across the Global 2000." Its headline is an aggregate: unplanned downtime costs those companies a combined $600 billion a year, averaging roughly $300 million per company. The research also reports the cost "surging 50% in just two years," which is the more useful fact than any single dollar amount, because it tells you the direction.
The per-company average hides enormous variance, so pair it with a distribution. PagerDuty's 2026 State of AI-First Operations report, conducted by Wakefield Research across 1,000 business and IT decision-makers, breaks per-hour losses into bands:
| Per-hour loss during an incident | Share of organizations |
|---|---|
| More than $1 million per hour | 8% |
| At least $500,000 per hour | 34% |
| More than $300,000 per hour | 68% |
The shape matters more than any midpoint. Two thirds of organizations lose more than $300,000 an hour, but only 8% cross a million. If you quote a single average, you describe almost none of them accurately.
Which downtime-cost numbers should you stop using?
Three figures show up constantly and should be retired.
Gartner's $5,600 per minute. This number dates to 2014, its original source page is no longer live, and Gartner itself later noted the figure varies enormously by organization. Quoting a 2014 point estimate as a current fact is the most common error in this genre.
The $793,957 figure. A specific-looking per-incident number that circulates without a dated methodology, and whose internal arithmetic does not reconcile against the per-minute figures it is usually paired with. Precision is not the same as accuracy. Drop it.
Any per-minute number presented without a distribution. Even the current research shows losses spanning more than an order of magnitude across organizations. A single dollar-per-minute headline, however recent, describes a distribution as if it were a point.
The pattern across all three is the same: a precise number with no live source, no sample, or no variance is worse than an honest range, because it invites a business case built on a figure nobody can defend in a review.
Why is a single dollar-per-minute figure misleading?
Because downtime cost is not a property of time. It is a property of what is down, for whom, and when.
A checkout service down during a promotion costs a multiple of the same service down at 4am on a Tuesday. An internal dashboard down for an hour may cost almost nothing in revenue while still burning engineer time and eroding trust. The Splunk research is explicit that the damage extends past revenue: the PagerDuty data lists "damaging brand reputation (52%)," "recovery costs (50%)," and "developer burnout (42%)" as incident impacts, none of which appear in a per-minute revenue figure.
This is why a defensible internal number is built from your own services rather than borrowed from a survey. The industry figures tell you the order of magnitude and the direction. They do not tell you what your next incident will cost.
How do you estimate your own downtime cost?
Assemble it from components you can measure, and state the assumptions inline so the number survives scrutiny.
- Segment by service, not by company. Compute exposure for your top few revenue-bearing services separately. A blended average across all services is the same mistake as a blended industry figure.
- Split revenue loss from recovery cost. Direct revenue loss during the outage is one line. Engineer hours spent on response and cleanup is another. The PagerDuty data shows recovery cost is a top-three impact in its own right.
- Weight by time and event. Peak versus trough traffic changes the revenue line by multiples. Model the realistic bad case, not the average minute.
- Add the costs that are not revenue. Reputation, customer churn, and burnout are real and are cited as major impacts in the 2026 research, even though they resist a clean dollar figure. Name them as qualitative line items rather than omitting them.
- Frame every number as an estimate with its assumptions attached. A downtime figure a finance team can pick apart is worth more than a precise one they cannot trace.
The point of the exercise is not a bigger headline. It is a number you can defend, which is a different and more useful thing.
What actually reduces the cost?
Two levers move the total, and neither is a monitoring dashboard.
Reduce how long incidents last. Cost scales with duration, so the diagnosis phase is where money is saved. Most of the elapsed time in an incident is spent figuring out what broke, not fixing it once known. This is the case for autonomous investigation: an agent that reads telemetry, queries infrastructure, and arrives at a hypothesis compresses the most expensive phase. It maps directly to the root cause analysis process for SREs and to AI-powered incident investigation.
Contain blast radius so fewer incidents reach the expensive bands. The PagerDuty distribution shows the cost is concentrated in incidents that hit revenue-bearing services broadly. Bounded change, fast rollback, and dependency-aware blast-radius analysis keep more incidents in the cheap bands. This is the containment argument made in on-call for code you didn't write and in multi-cloud incident management.
A note on honesty, because this is an AI SRE vendor writing about the cost of slow incidents. Faster diagnosis lowers duration only when the diagnosis is correct. A confidently wrong root cause can extend an incident rather than shorten it, which is why AI SRE accuracy and human approval of any action matter as much as speed. The cost argument for automation is real, but it is an argument for correct fast diagnosis, not for autonomy.
Try it against your own incident data
Aurora is Apache 2.0, so a team can put an agent on its own infrastructure and measure the diagnosis-time reduction directly rather than trusting a projection. The only external requirement is one LLM API key; cloud connectors are optional.
git clone https://github.com/arvo-ai/aurora.git && cd aurora

make init                # generates secrets, copies .env.example to .env
nano .env                # add OPENROUTER_API_KEY (or OPENAI_API_KEY / ANTHROPIC_API_KEY)
make prod-prebuilt       # pulls prebuilt images from GHCR and starts
Open http://localhost:3000. The first user to register becomes admin.
- Start free: aurora-ai.net (hosted, no infrastructure to run)
- GitHub: github.com/Arvo-AI/aurora
- Related guides: Root Cause Analysis for SREs · AI-Powered Incident Investigation · Multi-Cloud Incident Management · On-Call for Code You Didn't Write
Sourcing note. Aggregate and per-company figures are from Splunk's downtime report with Oxford Economics (2,000 Global 2000 executives). Per-hour distribution and non-revenue impacts are from PagerDuty's 2026 State of AI-First Operations report (Wakefield Research, 1,000 respondents, March 17, 2026). The retired figures (Gartner's 2014 $5,600 per minute and the $793,957 figure) are named as unusable rather than cited. No Aurora MTTR or cost-reduction figure is claimed, because no such benchmark exists. Verified August 27, 2026.